Connect SonarQube to QE Score: Get your first code quality metrics!
- qescore
- Apr 22, 2025
- 4 min read

Updated: Jun 19, 2025
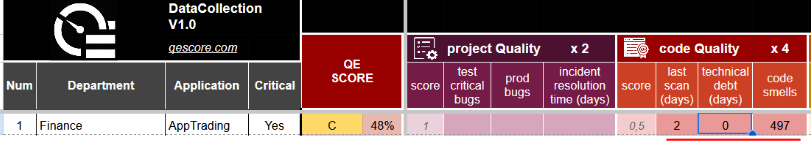
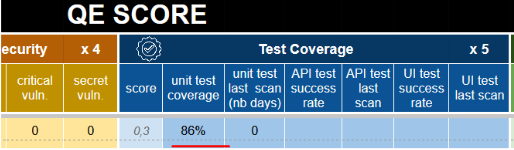
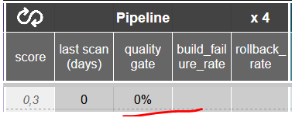
In this article, you'll learn how to connect SonarQube to QE Score to automatically pull in your code quality metrics — such as lines of code, duplication, test coverage, last scan date, code smells, quality gate status, and more. 🚀
In just a few minutes, your QE Score dashboard will display key insights straight from your Sonar analysis!

📺 How it works – demo video
🧠 Summary:
Step | Title | Estimated Time |
1 | Retrieve the Sonar project key | 5 min |
2 | Generate an access token | 3 min |
3 | Refresh data from QE Score | 1 min |
4 | Check the metrics | 1 min |
5 | View results in QE Score | 0 min |
🛠️ Prerequisites
✔️ Have completed the Data Collection setup via this article: 👉 "Download the Quick Start Kit and create your first QE Score in just 30 minutes!"
✔️ Have an active SonarQube project with available analysis data.
🔑 Step 1 – Retrieve your Sonar project key (⏱️ 5 min)
Log in to your SonarQube project
Click on "Information"
Copy the Project Key

📝 Next, in your Google Sheet (copy of QEscore_DataCollection_v1.0_starterkit), go to the repository_settings tab:
Column A ("Product"): your app’s name (e.g., AppTrading)
Column B ("RepositoryPath"): Git path (e.g., /github/myorg/myrepo)
Column C ("SonarURL"): Sonar base URL (e.g., https://sonar.qescore.com)
Column D ("SonarKey"): paste the Project Key you just copied 🔑

🔐 Step 2 – Generate a Sonar token (⏱️ 3 min)
Go to your Sonar user profile
Open the Security tab
Click Generate Token
Copy it and keep it safe! 🔒

🧩 Then, in your Google Sheet:
Go to Extensions > Apps Script
In the Project Settings
Add a new property named: token_sonar
Paste the token as the value
✅ Save!

🔄 Step 3 – Fetch Sonar data into QE Score (⏱️ 1 min)
🧠 In your Google Sheet, click on the QE SCORE menu > Refresh Data Sonar📥 The data will be automatically retrieved and displayed in your table..

🔍 Step 4 – Check the metrics on Sonar
Go back to your Sonar interface and open the project's Overall tab.
✅ You should see the same values as in your Sheet.

🎉 Step 5 – Congrats! Your first quality metrics are in
Go to the QE Score tab in your Google Sheet.You'll see the data integrated into the overall quality score calculation.And this is just the beginning! 🚀
➕ Step 6 – Add more SonarQube projects
You can follow the same process for multiple projects:
Add new rows in the repository_settings tab
Click Refresh Data Sonar again
QE Score will automatically compute an average per application, even across multiple Git repositories 👌
🧬 Step 7 – Customize the retrieved Sonar metrics
Want to take it further? Add new quality indicators!
Open the QEscore_Sonar.gs script in Apps Script
Modify the API calls to include additional metrics (e.g., bugs, vulnerabilities, etc.)
Add the corresponding columns in the repository_settings tab
📌 Note: The column names must be declared at the beginning of the script, in the columnIndices variable.
💻 Main Script – Automatically fetch quality data from Sonar
Here’s the main script to retrieve quality data from SonarQube.You can copy it as-is or adapt it to fit your needs 👇
function QESCORE_getSonar() {
  var sheetSettings = SpreadsheetApp.getActiveSpreadsheet().getSheetByName("repository_settings");
  var rawSettings = 3;
  var headers = sheetSettings.getRange(2, 1, 1, sheetSettings.getLastColumn()).getValues()[0];
  var tokenSonar = PropertiesService.getScriptProperties().getProperty('token_sonar');

  var columnIndices = {
    sonarURL: headers.indexOf("SonarURL"),
    sonarKey: headers.indexOf("SonarKey"),
    error: headers.indexOf("Error"),
    scriptExecution: headers.indexOf("ScriptExecution"),
    codeDuplication: headers.indexOf("CodeDuplication"),
    codeUnitTestCoverage: headers.indexOf("unitTestCoverage"),
    codeQualityGate: headers.indexOf("QualityGate"),
    codeSmell: headers.indexOf("CodeSmell"),
    scanDate: headers.indexOf("SonarScanDate"),
    loc: headers.indexOf("NumLines")
  };

  var todayHour = getTodayHour();

  while (sheetSettings.getRange(rawSettings, columnIndices.sonarKey + 1).getValue() !== "") {
    try {
      var rowData = sheetSettings.getRange(rawSettings, 1, 1, sheetSettings.getLastColumn()).getValues()[0];
      var sonarKey = rowData[columnIndices.sonarKey];
      var sonarURL = rowData[columnIndices.sonarURL];

      if (!sonarURL || sonarURL.trim() === "") {
        throw new Error("Missing SonarURL in sheet for row " + rawSettings);
      }

      if (!sonarKey || sonarKey.trim() === "") {
        rawSettings++;
        continue;
      }

      var encodedToken = Utilities.base64Encode(tokenSonar + ":");

      // 1. Duplicated code (%)
      var duplicationUrl = `${sonarURL}/api/measures/component?component=${sonarKey}&metricKeys=duplicated_lines_density`;
      var duplication = fetchSonarMetric(duplicationUrl, encodedToken, "duplicated_lines_density") / 100;

      // 2. Lines of code (ncloc)
      var locUrl = `${sonarURL}/api/measures/component?component=${sonarKey}&metricKeys=ncloc`;
      var loc = fetchSonarMetric(locUrl, encodedToken, "ncloc");

      // 3. Last scan date
      var dateUrl = `${sonarURL}/api/project_analyses/search?project=${sonarKey}&ps=1`;
      var scanDate = fetchSonarDate(dateUrl, encodedToken);

      // 4. Unit test coverage (%)
      var coverageUrl = `${sonarURL}/api/measures/component?component=${sonarKey}&metricKeys=coverage`;
      var coverage = fetchSonarMetric(coverageUrl, encodedToken, "coverage") / 100;

      // 5. Quality Gate status (OK / ERROR)
      var qualityGateUrl = `${sonarURL}/api/qualitygates/project_status?projectKey=${sonarKey}`;
      var qualityGateStatus = fetchSonarQualityGateStatus(qualityGateUrl, encodedToken);

      // 6. Code Smells
      var codeSmellUrl = `${sonarURL}/api/measures/component?component=${sonarKey}&metricKeys=code_smells`;
      var codeSmells = fetchSonarMetric(codeSmellUrl, encodedToken, "code_smells");

      // Writing values to the sheet
      sheetSettings.getRange(rawSettings, columnIndices.codeDuplication + 1).setValue(parseFloat(duplication));
      sheetSettings.getRange(rawSettings, columnIndices.loc + 1).setValue(parseInt(loc));
      sheetSettings.getRange(rawSettings, columnIndices.scanDate + 1).setValue(scanDate);
      sheetSettings.getRange(rawSettings, columnIndices.codeUnitTestCoverage + 1).setValue(parseFloat(coverage));
      sheetSettings.getRange(rawSettings, columnIndices.codeQualityGate + 1).setValue(qualityGateStatus);
      sheetSettings.getRange(rawSettings, columnIndices.codeSmell + 1).setValue(parseInt(codeSmells));
      sheetSettings.getRange(rawSettings, columnIndices.scriptExecution + 1).setValue(todayHour);
    } catch (e) {
      var errorMessage = `${todayHour} - Error: ${e.message}`;
      sheetSettings.getRange(rawSettings, columnIndices.error + 1).setValue(errorMessage);
    }
    rawSettings++;
  }
}

// Fetches a specific metric value from SonarCloud API
function fetchSonarMetric(url, encodedToken, metricKey) {
  var options = {
    'headers': {
      'Authorization': 'Basic ' + encodedToken,
      'Accept': 'application/json'
    }
  };
  var response = UrlFetchApp.fetch(url, options);
  var result = JSON.parse(response.getContentText());
  return result.component.measures[0].value;
}

// Fetches the date of the last analysis
function fetchSonarDate(url, encodedToken) {
  var options = {
    'headers': {
      'Authorization': 'Basic ' + encodedToken,
      'Accept': 'application/json'
    }
  };

  var response = UrlFetchApp.fetch(url, options);
  var result = JSON.parse(response.getContentText());
  var isoDate = result.analyses[0].date;
  var parsedDate = new Date(isoDate);
  return Utilities.formatDate(parsedDate, Session.getScriptTimeZone(), "dd/MM/yyyy HH:mm");
}

// Fetches the Quality Gate status (OK, ERROR, etc.)
function fetchSonarQualityGateStatus(url, encodedToken) {
  var options = {
    'headers': {
      'Authorization': 'Basic ' + encodedToken,
      'Accept': 'application/json'
    }
  };

  var response = UrlFetchApp.fetch(url, options);
  var result = JSON.parse(response.getContentText());
  var status = result.projectStatus.status;
  return status === "OK" ? "PASSED" : "FAILED";
}

function getTodayHour() {
    return Utilities.formatDate(new Date(), SpreadsheetApp.getActive().getSpreadsheetTimeZone(), "dd/MM/yyyy HH:mm");
}


Comments