QE SCORE
QE Score: Access a dashboard template
'Check out this example, manipulate the data, and get inspired to create your own dashboard'
The Dashboard is a key tool that relies on Data Collection to extract useful and strategic information. It serves as the single entry point for all stakeholders involved (developers, QA, Tech Leads, Project Managers, CTO, etc.). It allows for the daily tracking of quality indicators and visualizing their evolution over time. More than just a tracking tool, it becomes a lever for decision-making in the Quality approach. Depending on the needs, it can display data views at different hierarchical levels, enabling detailed analysis tailored to each user profile.
Tools such as Looker Studio, Power BI, or Grafana allow for the rapid creation of these dashboards.
An example of a Looker Studio dashboard based on real data collection is available for inspiration (link below):


QE Score: Examples of reporting
'Extracts of meaningful charts from the 3 views'

'Application' view
Monitoring the evolution over time of the QE Score for an application

'Application' view
Summary of the status of each type of test and levers for improvement

'Application' view
Status and monitoring of test coverage by level and compliance with rules

'Application' view
Status and monitoring of code quality and compliance with rules

'Department' view
Evolution and monitoring of the QE Score for applications in a domain
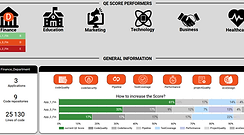
'Department' view
Summary of the QE Score for applications and domains

'Department' view
Status and monitoring of compliance of aggregated pipelines in the domain

'Department' view
Status and monitoring of the number of critical bugs aggregated to the domain

'Non-compliance' view
List of applications with a low QE Score ("critical" < "C")

'Non-compliance' view
List of applications that do not comply with the imposed rules

'Non-compliance' view
Filter on non-compliant applications in a domain

'Non-compliance' view
Filter on "critical" applications that do not comply with the rules